
Using AI for Visual Intelligence: Competitive Ad Creative Auditing Use Case
👉 Check out the self-serve notebook here: https://github.com/glombardo/Research/blob/main/Visual_Intelligence_for_Ad_Creative_Strategy_Using_Millions_of_Creative_Data_Points.ipynb
👉 And the sample data here: https://github.com/glombardo/Research/blob/main/vitamins_ads_data.csv

🧠 Business Case
In a competitive digital advertising landscape, brands frequently launch dozens or even hundreds of creatives across platforms like Facebook, Instagram, and YouTube. However, identifying what visual themes or elements dominate a campaign — or comparing creative approaches across brands or publishers — is time-consuming and highly subjective when done manually.
This project introduces an automated, scalable solution to summarize and analyze ad creatives based on their predominant visual features, helping marketers and analysts answer:
What visual style or motif defines a brand’s recent campaign?
How do different sub-brands or publishers differ in creative execution?
Can we rapidly benchmark competitor creative strategies?
This unlocks opportunities for:
Faster creative audits
Competitive intelligence
Creative performance experimentation based on look & feel
🔍 Approach Taken
A 100% Google Colab-based workflow that:
Ingests raw creative-level data, including metadata like advertiser, brand, sub-brand, publisher, spend, and impressions.
Offers a user-friendly filtering interface using dropdowns.
Downloads and resizes image creatives from provided links.
Processes visual content with:
VGG16 CNN to extract high-level image features.
PCA for dimensionality reduction.
KMeans to identify the most representative image among the selection.
Displays a composite visual summary that reflects the most dominant design or motif.
🧭 How It Works (User Guide)
Upload your CSV file from Pathmatics (make sure it includes columns like "Advertiser", "Brand Root", "Brand (Major)", "Publisher", "Link to Creative", etc.).
Run all cells in the notebook to initialize packages and load the interface.

When the dropdown filters appear:
Select one or more values for:
Advertiser (like Procter & Gamble)
Brand (like Tide)
Sub-Brand (like Tide Pods)
Publisher (like Instagram)
You can select multiple, or leave blank to include all.
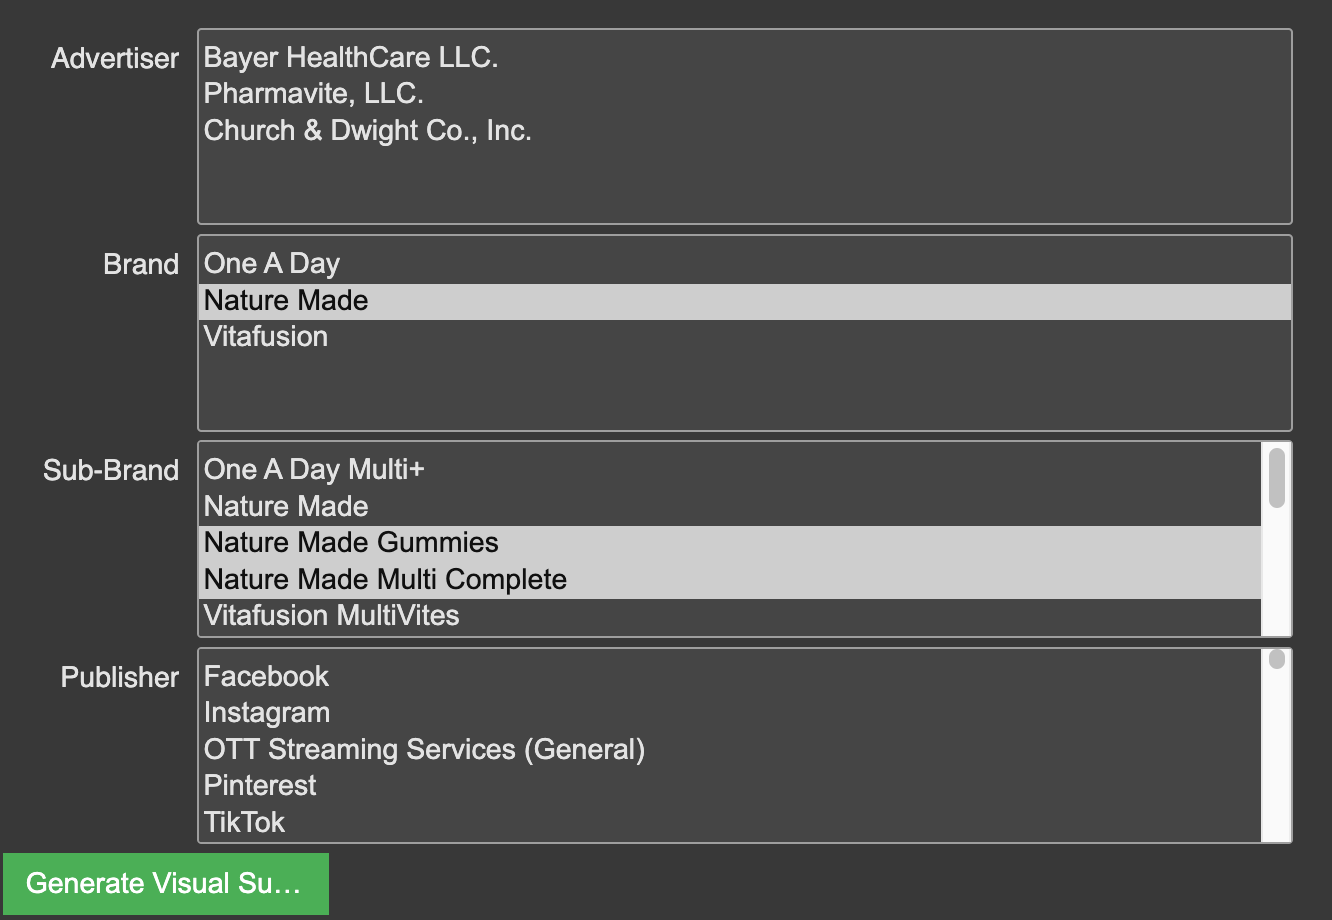
Click the "Generate Visual Summary" button.
The notebook will:
Download unique creatives matching your selection.
Analyze them and generate a visual representation of the most dominant creative in the cluster.

Interpret the result:
The displayed image represents the most central creative based on visual features, often reflecting common layout, color palette, or focal elements used by the brand in that campaign segment.
